
MetScape 3 for Cytoscape
The MetScape 3 App for Cytoscape provides a bioinformatics framework for the visualization and interpretation of metabolomic and expression profiling data in the context of human metabolism. It allows users to build and analyze networks of genes and compounds, identify enriched pathways from expression profiling data, and visualize changes in metabolite data. Gene expression and/or compound concentration data can be loaded from file(s) (in CSV, TSV, or Excel formats), or the user can directly enter individual compounds/genes (using KEGG compound IDs or Entrez Gene IDs) to build metabolic networks without loading a file. MetScape uses an internal relational database that integrates data from KEGG and EHMN.
News
CorrelationCalculator v1.0.1, featuring a revamped interface, is now available. MetScape v3.1.3, for use with Cytoscape 3.4.0 and higher, is now available.
New in MetScape 3.1
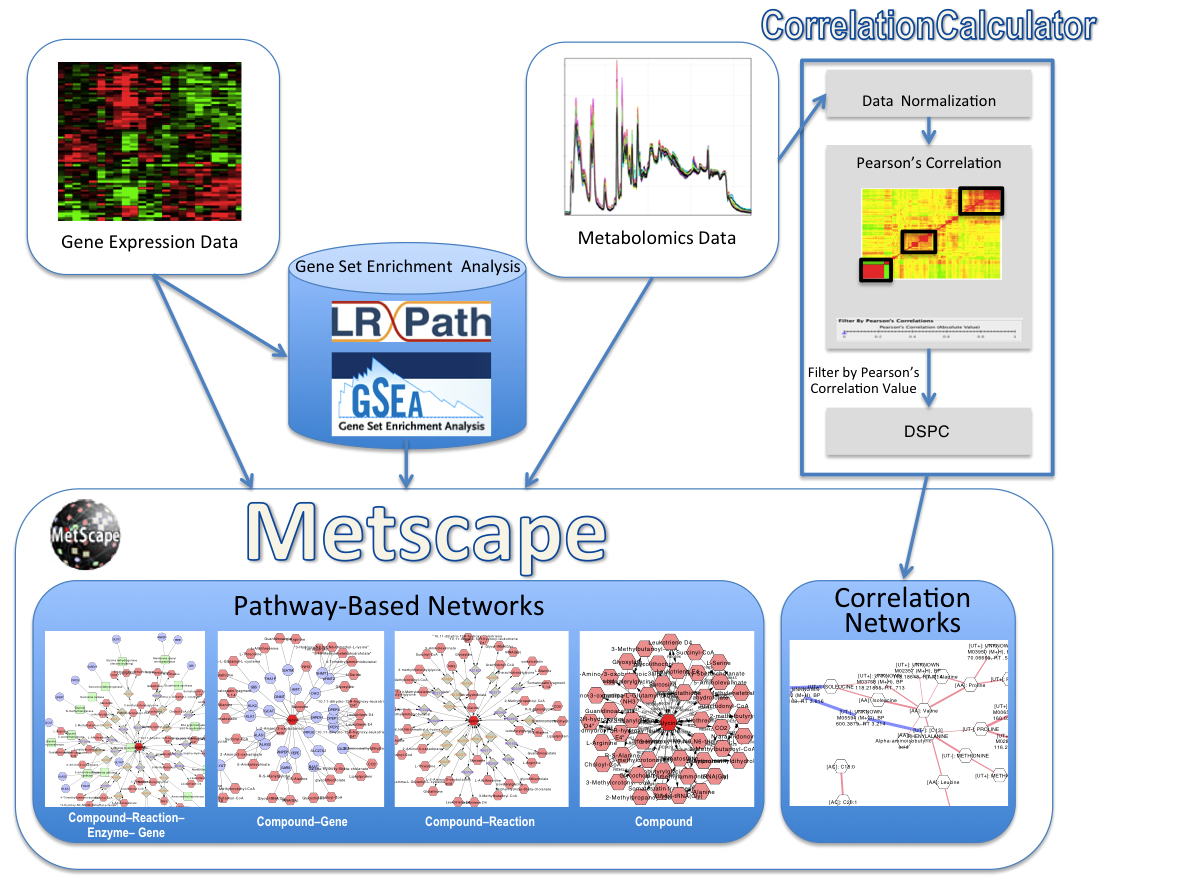
MetScape 3.1 supports building and visualization of correlation networks, in addition to pathway networks. We developed a new method that uses a Debiased Sparse Partial Correlation (DSPC) algorithm to identify connectivity among large numbers of metabolites using fewer samples. DSPC is implemented as part of our CorrelationCalculator program. DSPC was developed in collaboration with George Michailidis and Sumanta Basu.
MetScape Workflow
Please report any problems to metscape-help@umich.edu
Cite Metscape
Pathway-based networks:
Correlation-based networks: