MetScape 3 Input Files
Download sample input files: concepts.xlsx, genes.xlsx, metabolites.xlsx, correlations.xlsx, groups.xlsx
Input File Formats -- Pathway Networks
For pathway networks, MetScape 3 allows users to upload three types of files – compound files, gene files and concept files. Each type is optional, e.g. you can upload only compounds, only genes, only concepts, or any combination of the above.
Compound File
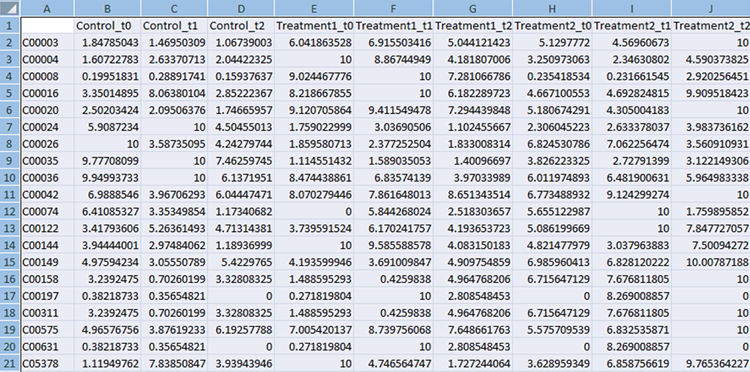
The first column should always contain KEGG compound IDs. The subsequent columns should contain normalized experimental measurements. If the experiment has several time points they should be listed in the adjacent columns, as shown in the example below, e.g. control t0, control t1, control t2 etc. The top row contains column headings that will be used to label the data.
Gene File
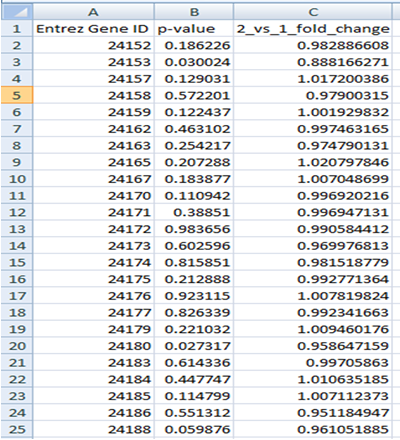
The first row should contain column headings that label the data. The first column should always contain Entrez Gene IDs. The second column should contain p-values for differentially expressed genes (e.g. from test). The third column can contain either log fold change or fold change values.
The gene file can contain all genes (e.g. from a microarray experiment) or significant genes only.
Please note that the list of all genes is required in order to run LRpath (see complete user manual for details).
Concept File
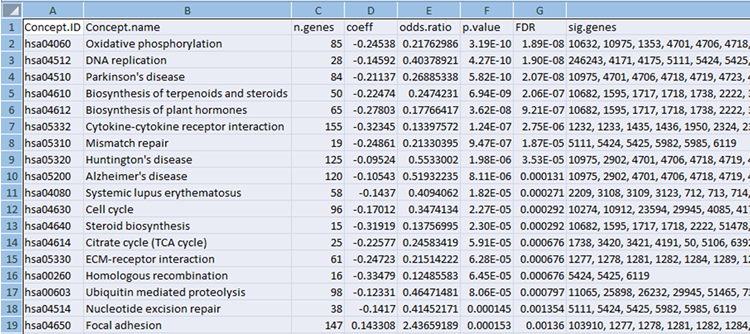
The concept file can be generated by gene set enrichment analysis tools such as LRpath or GSEA from gene expression data.
Gene set enrichment testing is an approach used to test for predefined biologically-relevant gene sets that contain more significant genes from an experimental dataset than expected by chance.
- GSEA (Subramanian at al., Proc. Natl. Acad. Sci. USA, 2005, 102, 15545-15550)
- LRpath (Sartor et al., 2009, Bioinformatics. 2009, 25(2):211-7.)
Input File Formats -- Correlation Networks
Starting with MetScape 3.1, correlation networks can also be built. These networks are based on experimental data provided in a correlation file. In addition, users can upload group definition files, grouping metabolites based on class, structure, or any other basis.
If you are starting from measurement data such as MS data, you may want to look into generating correlation files using our CorrelationCalculator tool.
Correlation File
The correlation file can be in either of two formats. The first is a column-based format consisting of pairs of metabolites in the first two columns followed by any number of pairwise correlation measurements between the two metabolites in subsequent columns. Some examples of measurements are Pearson's correlation coefficient, partial correlation coefficient, p-value, q-value and adjusted p-value.
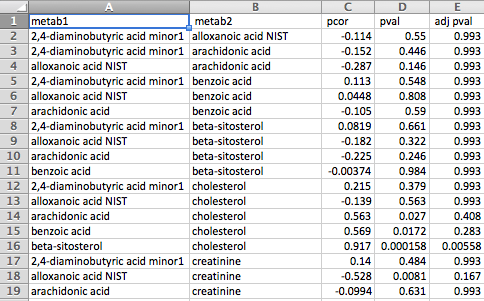
The second format is a matrix format consisting of metabolite names across the first row and column and correlation measurements between each pair of metabolites in the corresponding cells. Please note that only a single measurement for each metabolite pair is supported by this format, whereas the first format supports any number of measurements for each pair of metabolites.

Group File
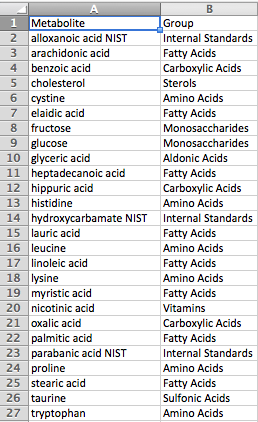
The group definition file has a simple two-column format, with metabolite names in the first column and the corresponding group names in the second column. Any metabolites not included in the group file will be considered part of a single additional group for visualization purposes. Group files are optional.
